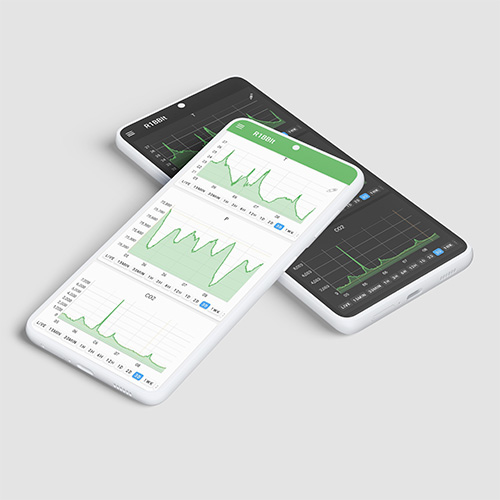
A powerful new visualization feature has arrived in the R1BBIT app: Graph Widget.
Users can now view any variable as a live or historical chart, making data tracking and analysis significantly more intuitive.
Key capabilities include:
- Flexible time ranges, from real-time updates to up to 1 month of history when data is stored on the server
- Support for multiple sensor types — ideal for monitoring temperature, humidity, pressure, CO₂, and any other user-defined parameters
- Smooth scaling and scrolling, allowing you to inspect both current values and long-term trends
With the Graph widget, R1BBIT evolves from a control interface into a full monitoring dashboard — perfect for home automation, environmental tracking, and experimental projects.
More graph customization options — including multi-line charts and threshold alerts — are already planned for upcoming updates.
