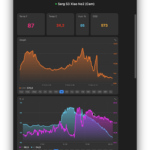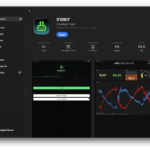
You can now visualize your device's data with real-time charts. Sensor readings, values, and trends appear as living graphs that update as the data arrives. This turns raw numbers into insight you can actually use. Whether you're tracking temperature, signal strength, or anything else, the picture is immediate.
Data you can see at a glance.